Note
Go to the end to download the full example code.
Output oriented model
The following DEA model is an output-oriented model where the outputs are maximizing and the inputs are kept at their current levels.
\[\begin{split}& \theta^* = \min \theta, subject \ to \\
& \sum_{j=1}^{n} \lambda_j x_{i, j} \leq x_{i, o}, i=1,2, \dots, m; \\
& \sum_{j=1}^{n} \lambda_j y_{r, j} \geq \theta y_{r, o}, r=1,2, \dots, s; \\
& \sum_{j=1}^{n} \lambda_j = 1 \\
& \lambda_j \geq 0, j=1,2, \dots, n.\end{split}\]
where \(DMU_o\) represents one of the \(n\) DMUs under evaluation, and \(x_{i, o}\) and \(y_{i, o}\) are the \(i\) th input and \(r\) th output for \(DMU_o\), respectively.
Import modules and prepare data.
Average of rental properties in a given district.
import matplotlib.pyplot as plt
import pandas as pd

from Pyfrontier.frontier_model import EnvelopDEA

rent_average_df = pd.DataFrame(
    {"rent": [5, 5, 5, 5], "n_room": [6, 5, 2, 3.0], "n_storage": [2, 3.5, 5, 3.5]}
)
rent_average_df
Fit dea model.
The necessity inputs are inputs and outputs. The result has below belongings.
dea = EnvelopDEA("CRS", "out")
dea.fit(
    rent_average_df[["rent"]].to_numpy(),
    rent_average_df[["n_room", "n_storage"]].to_numpy(),
)

dea.result[0]
EnvelopResult(score=1.0, id=0, dmu=DMU(input=array([5]), output=array([6., 2.]), id=0), weights=[1.0, 0.0, 0.0, 0.0], x_slack=[0.0], y_slack=[0.0, 0.0], orientation='out')
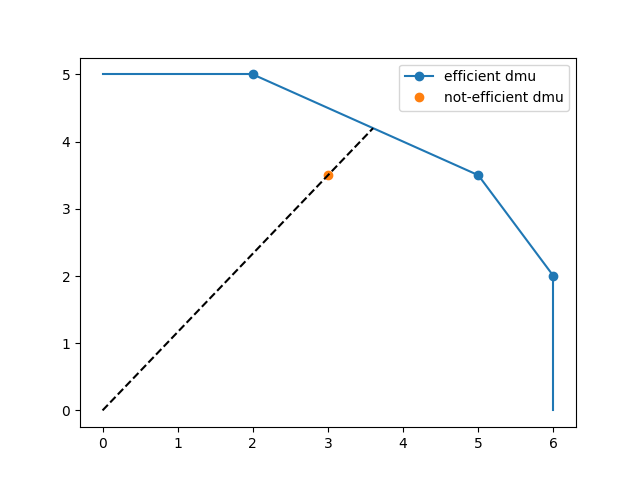
Visualize the result.
In the built documentation.
eff_dmu = [r.dmu for r in dea.result if r.is_efficient]
ineff_dmu = [r.dmu for r in dea.result if r.is_efficient != 1]

plt.figure()
plt.plot(
    [d.output[0] for d in eff_dmu],
    [d.output[1] for d in eff_dmu],
    "-o",
    label="efficient dmu",
)
plt.plot(
    [d.output[0] for d in ineff_dmu],
    [d.output[1] for d in ineff_dmu],
    "o",
    label="not-efficient dmu",
)
plt.plot([6, 6], [2, 0], color="C0")
plt.plot([2, 0], [5, 5], color="C0")
plt.plot([0, 3.6], [0, 4.2], color="black", linestyle="--")

plt.legend()
plt.show()
About slack
In the built documentation.
[1.0, 1.0, 1.0, 1.2]
[True, True, True, False]
[False, False, False, False]
[0.0] [0.0, 0.0]
Total running time of the script: (0 minutes 0.072 seconds)