Note
Go to the end to download the full example code.
Additive model
Preparing…
Import modules and prepare data.
Average of rental properties in a given district.
import matplotlib.pyplot as plt
import numpy as np
import pandas as pd

from Pyfrontier.frontier_model import AdditiveDEA

df = pd.DataFrame(
    {"input_1": [1, 1.5, 3, 3], "input_2": [3, 1.5, 1, 3], "output": [16, 16, 16, 16]}
)
df
No weight.
The necessity inputs are inputs and outputs. The result has below belongings.
dea = AdditiveDEA("CRS")
dea.fit(
    df[["input_1", "input_2"]].to_numpy(),
    df[["output"]].to_numpy(),
)

dea.result[0]
AdditiveResult(score=nan, id=0, dmu=DMU(input=array([1., 3.]), output=array([16]), id=0), x_slack=[0.0, 0.0], y_slack=[0.0], weights=[1.0, 0.0, 0.0, 0.0])
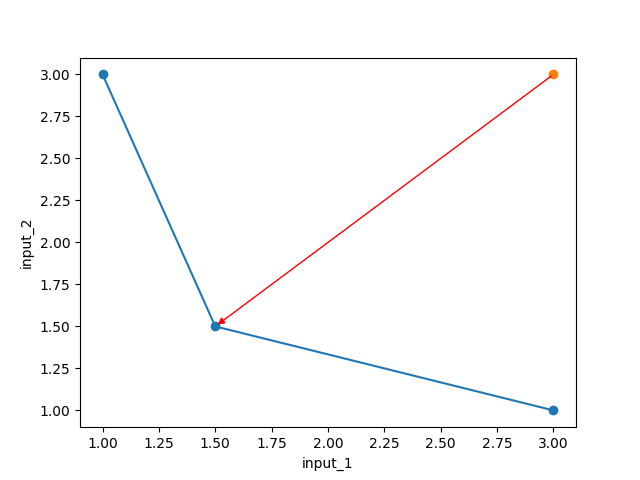
In the built documentation.
eff_dmu = [r.dmu for r in dea.result if r.is_efficient]
ineff_dmu = [r.dmu for r in dea.result if r.is_efficient != 1]

plt.figure()
plt.plot(
    [d.input[0] for d in eff_dmu],
    [d.input[1] for d in eff_dmu],
    "-o",
    label="efficient dmu",
)
plt.plot(
    [d.input[0] for d in ineff_dmu],
    [d.input[1] for d in ineff_dmu],
    "o",
    label="not-efficient dmu",
)
plt.annotate(
    "", xy=[1.5, 1.5], xytext=[3, 3], arrowprops=dict(arrowstyle="-|>", color="red")
)
plt.xlabel("input_1")
plt.ylabel("input_2")
Text(33.972222222222214, 0.5, 'input_2')
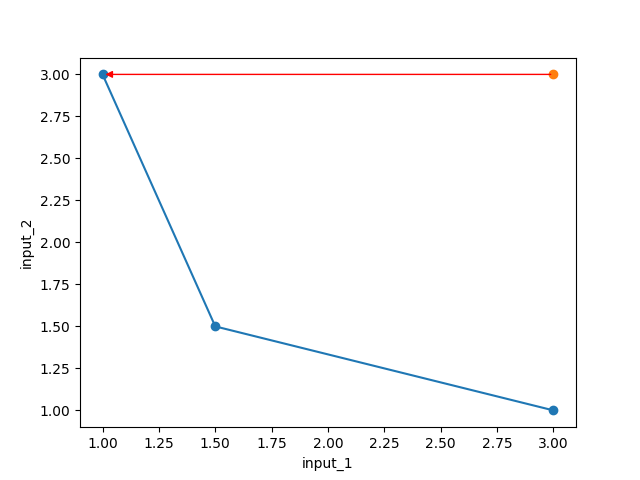
With weight.
The necessity inputs are inputs and outputs. The result has below belongings.
dea_with_weight = AdditiveDEA("CRS")
dea_with_weight.fit(
    df[["input_1", "input_2"]].to_numpy(),
    df[["output"]].to_numpy(),
    x_weight=np.array([0.8, 0.2]),
    y_weight=np.array([0]),
)

dea_with_weight.result[-1]
AdditiveResult(score=nan, id=3, dmu=DMU(input=array([3., 3.]), output=array([16]), id=3), x_slack=[2.0, 0.0], y_slack=[0.0], weights=[1.0, 0.0, 0.0, 0.0])
plt.figure()
plt.plot(
    [d.input[0] for d in eff_dmu],
    [d.input[1] for d in eff_dmu],
    "-o",
    label="efficient dmu",
)
plt.plot(
    [d.input[0] for d in ineff_dmu],
    [d.input[1] for d in ineff_dmu],
    "o",
    label="not-efficient dmu",
)
plt.annotate(
    "", xy=[1, 3], xytext=[3, 3], arrowprops=dict(arrowstyle="-|>", color="red")
)
plt.xlabel("input_1")
plt.ylabel("input_2")
Text(33.972222222222214, 0.5, 'input_2')
References
See also
- Author
Charnes and W.W. Cooper and L. Seiford and J. Stutz.
- Title
A multiplicative model for efficiency analysis,
Socio-Economic Planning Sciences, 1982.
https://www.sciencedirect.com/science/article/pii/0038012182900295.
Total running time of the script: (0 minutes 0.128 seconds)