Note
Go to the end to download the full example code.
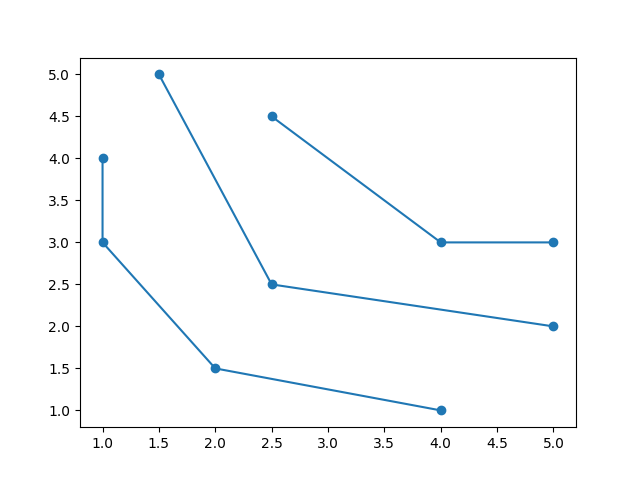
Context-dependent DEA
Preparing…
Import modules and prepare data.
import matplotlib.pyplot as plt
import pandas as pd

from Pyfrontier.frontier_model import EnvelopDEA, HierarchalDEA
df = pd.DataFrame(
    {
        "input_1": [4, 2, 1, 1, 5, 2.5, 1.5, 5, 4, 2.5],
        "input_2": [1, 1.5, 3, 4, 2, 2.5, 5, 3, 3, 4.5],
        "output": [3, 3, 3, 3, 3, 3, 3, 3, 3, 3],
    }
)

h_dea = HierarchalDEA(EnvelopDEA("CRS", "in"))

h_dea.fit(df[["input_1", "input_2"]].to_numpy(), df[["output"]].to_numpy())

h_dea.result[0]
[EnvelopResult(score=1.0, id=0, dmu=DMU(input=array([4., 1.]), output=array([3]), id=0), weights=[1.0, 0.0, 0.0, 0.0, 0.0, 0.0, 0.0, 0.0, 0.0, 0.0], x_slack=[4.9997784e-12, -1.25e-12], y_slack=[0.0], orientation='in'), EnvelopResult(score=1.0, id=1, dmu=DMU(input=array([2. , 1.5]), output=array([3]), id=1), weights=[0.0, 1.0, 0.0, 0.0, 0.0, 0.0, 0.0, 0.0, 0.0, 0.0], x_slack=[1.6667223e-12, 5.0001669e-12], y_slack=[0.0], orientation='in'), EnvelopResult(score=1.0, id=2, dmu=DMU(input=array([1., 3.]), output=array([3]), id=2), weights=[0.0, 0.0, 1.0, 0.0, 0.0, 0.0, 0.0, 0.0, 0.0, 0.0], x_slack=[0.0, 8.3266727e-13], y_slack=[0.0], orientation='in'), EnvelopResult(score=1.0, id=3, dmu=DMU(input=array([1., 4.]), output=array([3]), id=3), weights=[0.0, 0.0, 0.0, 1.0, 0.0, 0.0, 0.0, 0.0, 0.0, 0.0], x_slack=[-9.9972244e-13, 1.0], y_slack=[0.0], orientation='in')]
plt.figure()
for res in h_dea.result:
    plt.plot(
        [r.dmu.input[0] for r in res],
        [r.dmu.input[1] for r in res],
        "o-",
        color="C0",
    )
References
See also
- Author
Lawrence M. Seiford and Joe Zhu.
- Title
Context-dependent data envelopment analysis—Measuring attractiveness and progress,
Omega-international Journal of Management Science, 2003.
https://EconPapers.repec.org/RePEc:eee:jomega:v:31:y:2003:i:5:p:397-408.
Total running time of the script: (0 minutes 0.146 seconds)