Note
Go to the end to download the full example code.
Returns to scale
Preparing…
Import modules and prepare data.
Average of rental properties in a given district.
import matplotlib.pyplot as plt
import pandas as pd
from Pyfrontier.frontier_model import MultipleDEA
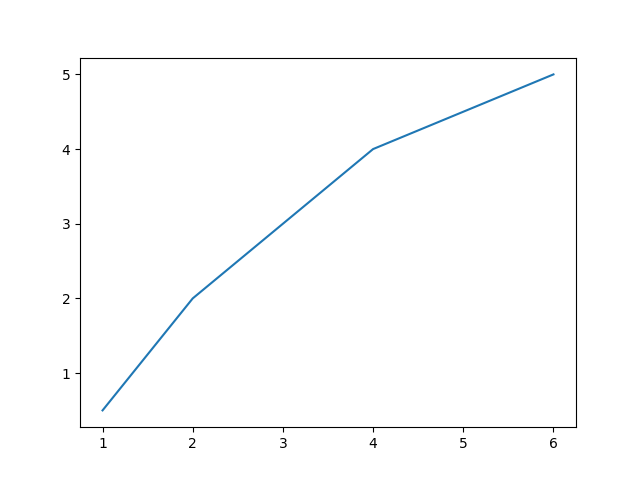
sample_df = pd.DataFrame(
{
"input": [
1,
2,
4,
6,
],
"output": [
0.5,
2,
4,
5,
],
}
)
sample_df
Fit dea model.
The necessity inputs are inputs and outputs. The result has below belongings.
dea = MultipleDEA("VRS", "in")
dea.fit(
    sample_df[["input"]].to_numpy(),
    sample_df[["output"]].to_numpy(),
)

dea.result
[MultipleResult(score=np.float64(1.0), id=0, dmu=DMU(input=array([1]), output=array([0.5]), id=0), x_weight=[1.0], y_weight=[0.0], bias=1.0), MultipleResult(score=np.float64(1.0), id=1, dmu=DMU(input=array([2]), output=array([2.]), id=1), x_weight=[0.5], y_weight=[0.333333], bias=0.333333), MultipleResult(score=np.float64(1.0), id=2, dmu=DMU(input=array([4]), output=array([4.]), id=2), x_weight=[0.25], y_weight=[0.25], bias=0.0), MultipleResult(score=np.float64(1.0), id=3, dmu=DMU(input=array([6]), output=array([5.]), id=3), x_weight=[0.166667], y_weight=[0.333333], bias=-0.666667)]
plt.figure()
plt.plot(sample_df["input"], sample_df["output"])
[<matplotlib.lines.Line2D object at 0x7f54a2afe710>]
%%
Total running time of the script: (0 minutes 0.052 seconds)